The Advocate Program Ledger: 7 Numbers That Tell You What Your Program Actually Returns
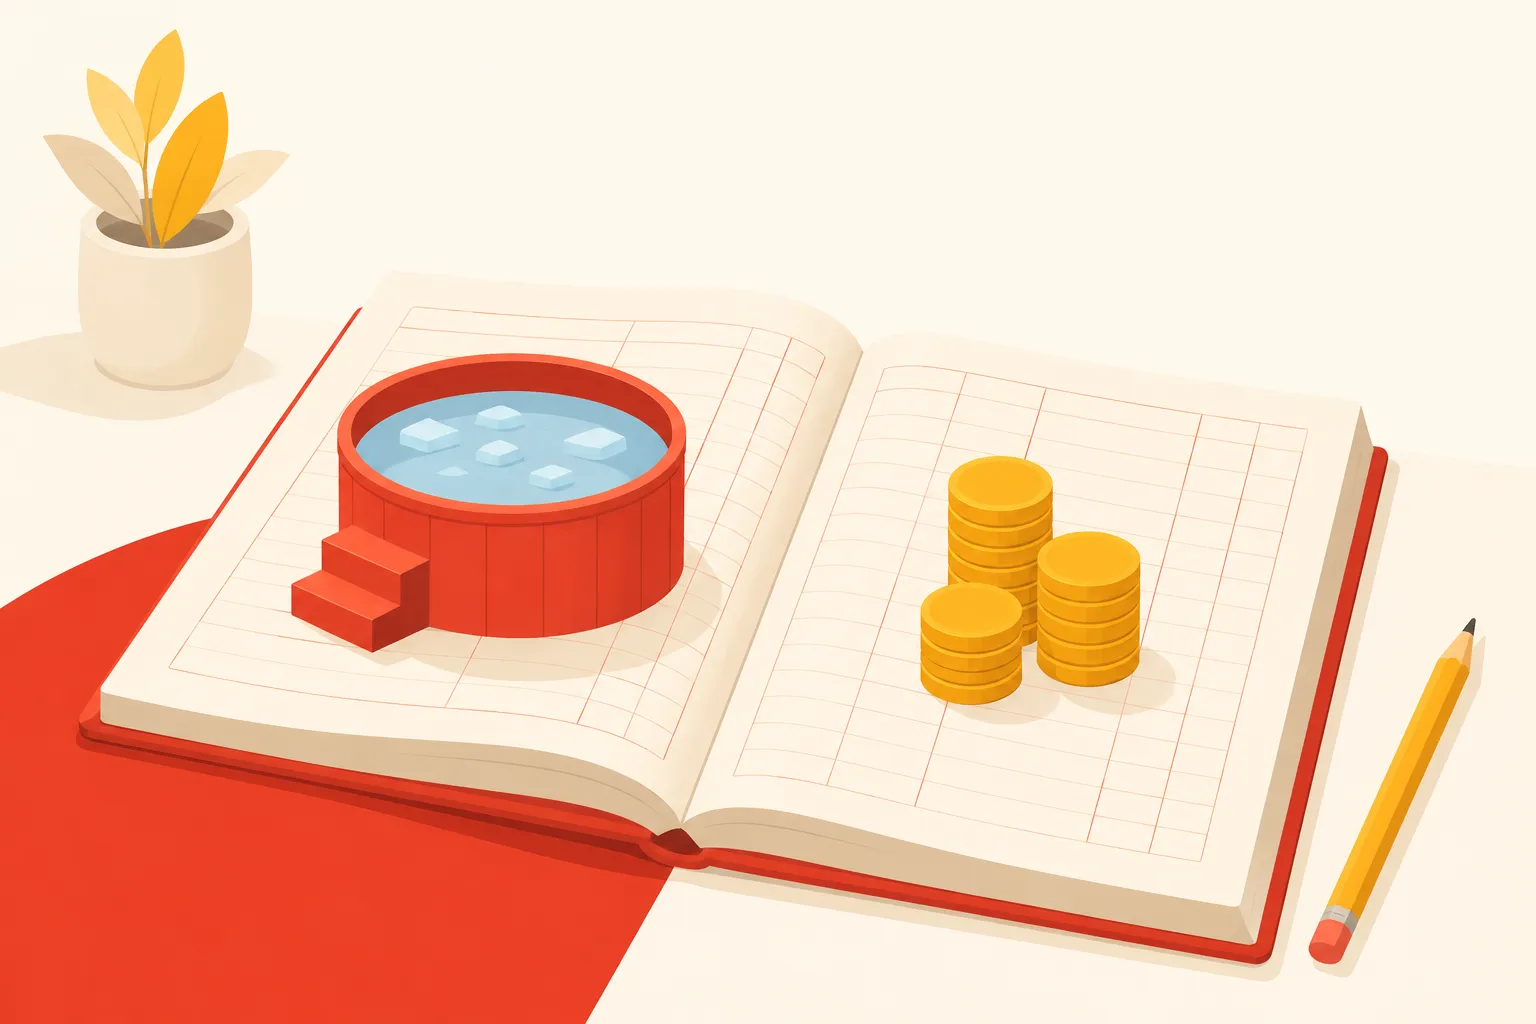
You know your CAC on Meta to the dollar. You probably know your ROAS by campaign, maybe by creative. So try this question: what did your advocate program return last quarter?
If the honest answer is “people seem to love it,” you’re running your highest-trust channel on vibes.
Affiliate marketers don’t have this problem. Their channel grew up under CFO scrutiny, so they learned to account for everything. I was listening to Yash Chavan on Honest Ecommerce recently, and he listed the six numbers every serious affiliate program lives by. None of them were out of the ordinary. And that’s what struck me. They’re the same kinds of numbers you’d use to judge any channel. Affiliate folks just track them with unusual consistency.
Advocacy is not affiliate marketing. Advocates are real customers talking with real prospects, not publishers chasing a payout. But the accounting discipline transfers almost perfectly, and most advocacy programs would be better run if they borrowed it.
We’ve written before about which advocacy metrics separate signal from noise. That piece covers the output side: conversations, attribution, community health. This one is about the ledger. Costs on one side, revenue on the other, and whether the math works.
To keep it concrete, I’ll run a fictional brand through every metric. Picture a premium cold plunge company: 250 enrolled advocates, a $4,500 average order, one brand manager spending a few hours a week on the program. All numbers cover a single quarter.
1. Revenue attributed to advocates
Total revenue from orders where an advocate played a part. Tracked links, personal discount codes, and purchases that follow a conversation or a shared offer all count.
The hard part is deciding what “played a part” means, and the affiliate world’s answer is useful: pick a rule, write it down, and apply it every quarter. A prospect who talks to an advocate on Tuesday and buys direct the following week should still count. The decision happened in the conversation. The click was paperwork. Set an attribution window that matches your sales cycle, not a default. A $50 kitchen gadget might close the same day; a cold plunge purchase can take a month or more.
Our cold plunge brand attributes 18 orders to advocates this quarter, worth $97,200.
2. Rewards and incentives paid
This is the advocacy version of affiliate commissions: everything you paid out to advocates. Gift cards, account credit, discounts they redeemed, cash if you go that route.
Affiliate programs treat commissions as their largest line item and watch it closely. Advocate programs usually pay far less per person, which is exactly why the number gets ignored. Track it anyway. It’s half of your cost side, and it tells you what a conversation costs you at the margin.
The cold plunge brand paid $6,000 in rewards this quarter. Most of that was $100 gift cards for completed conversations, plus a few larger thank-yous for advocates who hosted backyard demos.
3. Seeding cost
Affiliate managers send free product to creators and count it as a program expense. Advocates are already customers, so you’d think this line disappears. It doesn’t. It just changes shape.
Demo units for advocates who show the product in person. The new colorway you send your most active people so their recommendations stay current. Swag, welcome kits, the occasional replacement part you comp because someone is out there vouching for you. All of it is real money spent to make advocacy work, and it belongs in the denominator when you calculate ROI or ROAS for the program.
Our brand sent its ten most active advocates an insulated cover and a year of water-care supplies, about $400 each: $4,000.
4. Activity rate
Enrolled advocates are potential. Active advocates are capacity. Activity rate is the percentage of your roster that did anything this period: had a conversation, shared an offer, replied to a prospect.
Yash’s example on the podcast was 100 active out of 1,000 enrolled, or 10%, and he treated that as normal for affiliate programs. Advocacy runs similar. If 250 people signed up and 30 engaged this quarter, your activity rate is 12%, and the 30 are your real program. Every capacity question (how many prospects can we route? do we need to recruit?) should use the active number, not the enrolled one. This is the same reason your Stoked dashboard leads with active advocates rather than total enrolled.
A falling activity rate is also your earliest warning. Revenue lags engagement by a quarter or two, so by the time attributed revenue dips, the advocates checked out months ago.
5. Customer acquisition cost through advocates
Take everything the program cost this quarter (rewards, seeding, software, the loaded cost of the hours someone spends running it) and divide by the number of new customers it produced. Not orders. New customers.
Then put that number next to your paid CAC. This is the comparison that gets advocacy taken seriously in a budget meeting. It turns “our customers love talking about us” into a channel cost anyone can weigh.
The cold plunge brand’s full program cost is $12,500 for the quarter: $6,000 in rewards, $4,000 in seeding, and $2,500 covering the platform and the program manager’s time. Of the 18 attributed orders, 15 came from new customers. That’s an $833 CAC against a blended paid CAC of $1,500.
6. Average order value comparison
Compare the AOV of advocate-attributed orders with your site-wide AOV. If the program is working, advocate-influenced buyers should spend more. They arrive with their questions already answered by someone who owns the product, so they hedge less. They skip the entry-level tub, they add the chiller upgrade and the insulated cover.
Advocate AOV at or below site average is a diagnostic, not a failure. It usually means advocates are being used as a coupon channel rather than a confidence channel. The fix is in how offers are framed, not in the advocates themselves.
Our brand’s advocate-attributed orders average $5,400 against a $4,500 site average, a 20% premium.
7. Conversation-to-sale rate
Affiliate programs can’t measure this one. They don’t have conversations. When a prospect reaches a real owner and talks with them, what share of those chats end in a purchase within your attribution window?
For big-ticket products this rate is startling. Nothing else in your funnel comes close. People don’t message an advocate casually; they’re already serious, and the conversation clears the doubts that stall checkouts. Our cold plunge brand saw 40 conversations this quarter. Twelve turned into purchases, a 30% conversation-to-sale rate. Ad clicks do not do that.
If you track only one thing beyond revenue and cost, track this. It’s the clearest proof that the mechanism works, not just the channel.
Putting the quarter together
Here’s the cold plunge brand’s ledger:
| Line | Amount |
|---|---|
| Revenue attributed to advocates | $97,200 |
| Rewards and incentives | $6,000 |
| Seeding | $4,000 |
| Platform and admin time | $2,500 |
| Total program cost | $12,500 |
Run the Advocacy ROI formula: revenue minus cost, divided by cost. Here that’s $97,200 minus $12,500, divided by $12,500. Just under 7:1. Every dollar into the program came back with almost seven friends, at roughly half the paid CAC, with orders 20% larger than the site average. High-ticket math is forgiving like that: when one conversation can move a $5,000 order, even a modest program covers its costs fast.
No single metric makes that case. Revenue looks great until you subtract the costs, and activity rate counts people rather than dollars. Together, the seven numbers answer the only question that matters: is this channel earning its budget?
Start with two
You don’t need all seven this quarter. Start with attributed revenue and total program cost. Both live in spreadsheets you already have, and those two alone get you a defensible ROI number. Add activity rate and the AOV comparison next. The rest can follow.
We’re building this kind of measurement into Stoked’s analytics now. That includes numbers like conversation-to-sale rate, which no affiliate dashboard would think to show. More on that soon.
If you want help thinking through what attribution should look like for your program, reach out. This is the part of advocacy I like arguing about most.
Related reading
- Measuring Advocacy Impact: Five Metrics That Actually Matter: the output side of measurement, including conversations and community health
- The Brand Advocacy Ratio: the full ROI formula and what belongs in each term
- Switching to Stoked, Seeing Results: Bunch Bikes Case Study: what 40% advocate-driven sales looks like in practice